Pivot point studies highlight prices considered to be a likely turning point when looking at values from a previous period, whether it be daily, weekly, quarterly or annual. Each pivot point study has its own characteristics on how these points are calculated. The formula applied for the Camarilla Pivot Points is:
Define: Range = High - Low
Pivot Point (P) = (High + Low + Close) / 3
Support 1 (S1) = Close - Range * (1.1 / 12)
Support 2 (S2) = Close - Range * (1.1 / 6)
Support 3 (S3) = Close - Range * (1.1 / 4)
Support 4 (S4) = Close - Range * (1.1 / 2)
Support 5 (S5) = Close - (R5 - Close)
Resistance 1 (R1) = Close + Range * (1.1 / 12)
Resistance 2 (R2) = Close + Range * (1.1 / 6)
Resistance 3 (R3) = Close + Range * (1.1 / 4)
Resistance 4 (R4) = Close + Range * (1.1 / 2)
Resistance 5 (R5) = (High/Low) * Close
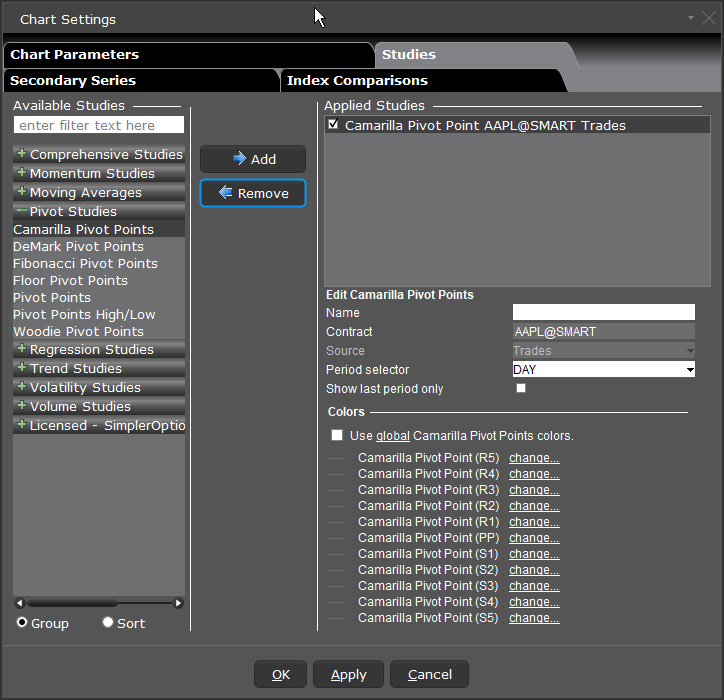
To add a Camarilla Pivot Point indicator
Complete parameters as necessary.
Note: It is possible that in some cases, for example when the closing price is near the high or low and there is a wide range, the S1 or R1 value will be above the PP.